

Easy tutorial on Spark SQL and DataFrames
In this tutorial, you will learn how to load a DataFrame and perform basic operations on DataFrames with both API and SQL.
I’m using colab to run the code.
First, we need to To download the required tools
!apt-get install openjdk-8-jdk-headless -qq > /dev/null
!wget -q https://downloads.apache.org/spark/spark-3.1.1/spark-3.1.1-bin-hadoop2.7.tgz
!tar -xvf spark-3.1.1-bin-hadoop2.7.tgz
!pip install -q findspark
Then, add this statement to tell your bash where to find spark. To do so, configure your $PATH variables by adding the following lines
import os
os.environ["JAVA_HOME"] = "/usr/lib/jvm/java-8-openjdk-amd64"
os.environ["SPARK_HOME"] = "/content/spark-3.1.1-bin-hadoop2.7"
Start a spark session
import findspark
findspark.init()
from pyspark.sql import SparkSession
spark = SparkSession.builder.master("local[*]").getOrCreate()
Manipulating dataframes
We need first to import the data file. There are different ways to import a file (from drive, from an URL, or from your local hard disk). Files.upload will upload a file from your hard disk, this is not# recommended for very large files (the example is based on the movielens csv file)
from google.colab import filesfiles.upload()
data = spark.read.format("csv")\
.option("delimiter", ",")\
.option("header", True)\
.load("ratings.csv")
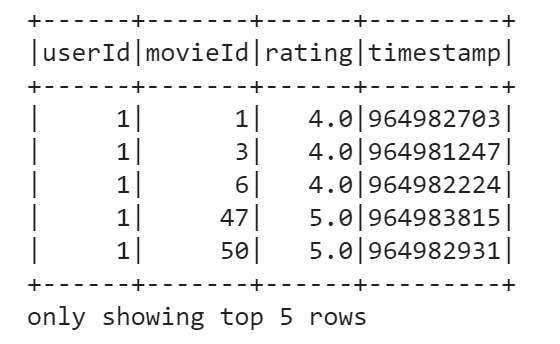
data.show(5)
print((data.count(), len(data.columns)))

To take a glance at the data, we use the show() method. For instance, we can display first five rows:
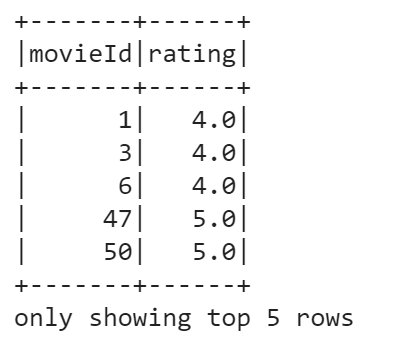
data.select("movieId", "rating").show(5)
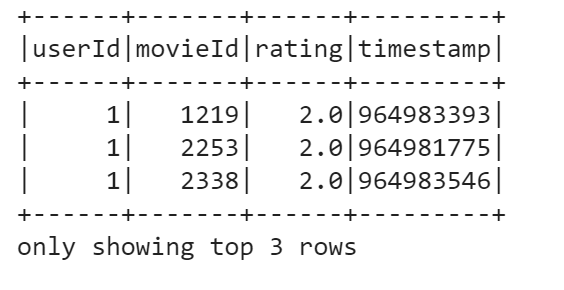
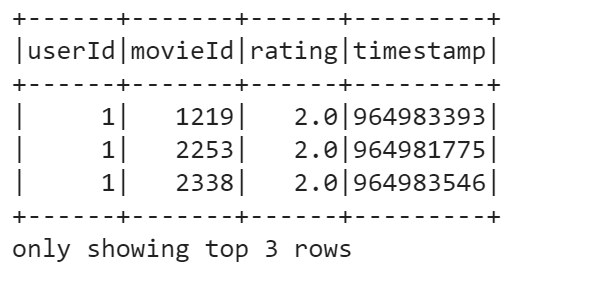
You can also filter the DataFrame based on some condition. Say, we want to choose movies with ratings lower than 3.0. To do this, run the following:
data.filter(data['rating'] < 3.0).show(3)
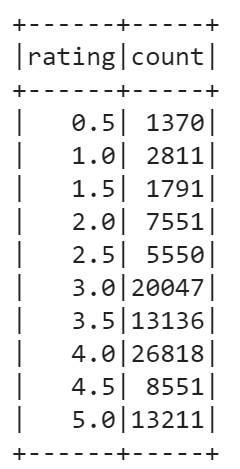
Another useful operation to perform on a DataFrame is grouping by some field. Let’s group our DataFrame by rating, check counts for each rating, and finally order the resulting counts by rating.
data.groupBy(data['rating']).count().orderBy('rating').show()
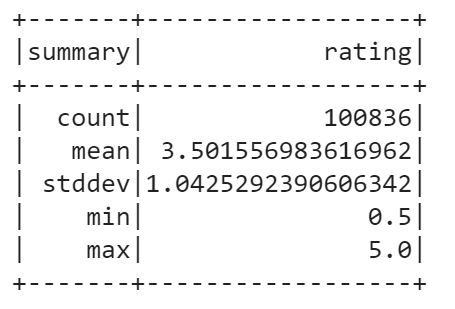
You can also calculate basic statistics for a DataFrame using describe() method. It includes min, max, mean, standard deviation, and count for numeric columns. You may specify columns or calculate overall statistics for a DataFrame. In our case, only rating column is suitable for statistics calculation.
data.describe("rating").show()
Using SQL API
#Now, we will use SQL to query the data. To begin with, we need to register a DataFrame as a temp view with the next command:
data.createOrReplaceTempView("ratings")
Let’s make the same filtering as before — we’ll select only movies with ratings lower than 3 using SQL:
spark.sql("select * from ratings where rating < 3").show(3)
You can download the code of this tutorial from this link